


Key Takeaways
- Python with Plotly, Pandas, Geopy creates interactive zip code maps for better visualization and analysis
- Accurate geocoded data is crucial; use GeoPostcodes for completeness and accuracy
- Customize maps with Plotly to display zip codes and attributes, enhancing geographic trend insights
- Zip code maps help uncover spatial patterns, optimize strategies, and improve data-driven decisions
Introduction
If you’re looking to visualize geographic data, like zip codes, Python offers an intuitive approach with powerful libraries. Creating a zip code map can help improve the presentation and understanding of spatial data, turning numbers into a visually appealing and interactive map.
In this article, we will explain the basics of zip codes and geospatial data, introduce some Python libraries that can help you create a zip code map, and guide you through a step-by-step example of how to produce it. By the end of this article, you will be able to use Python code to map zips like a pro.
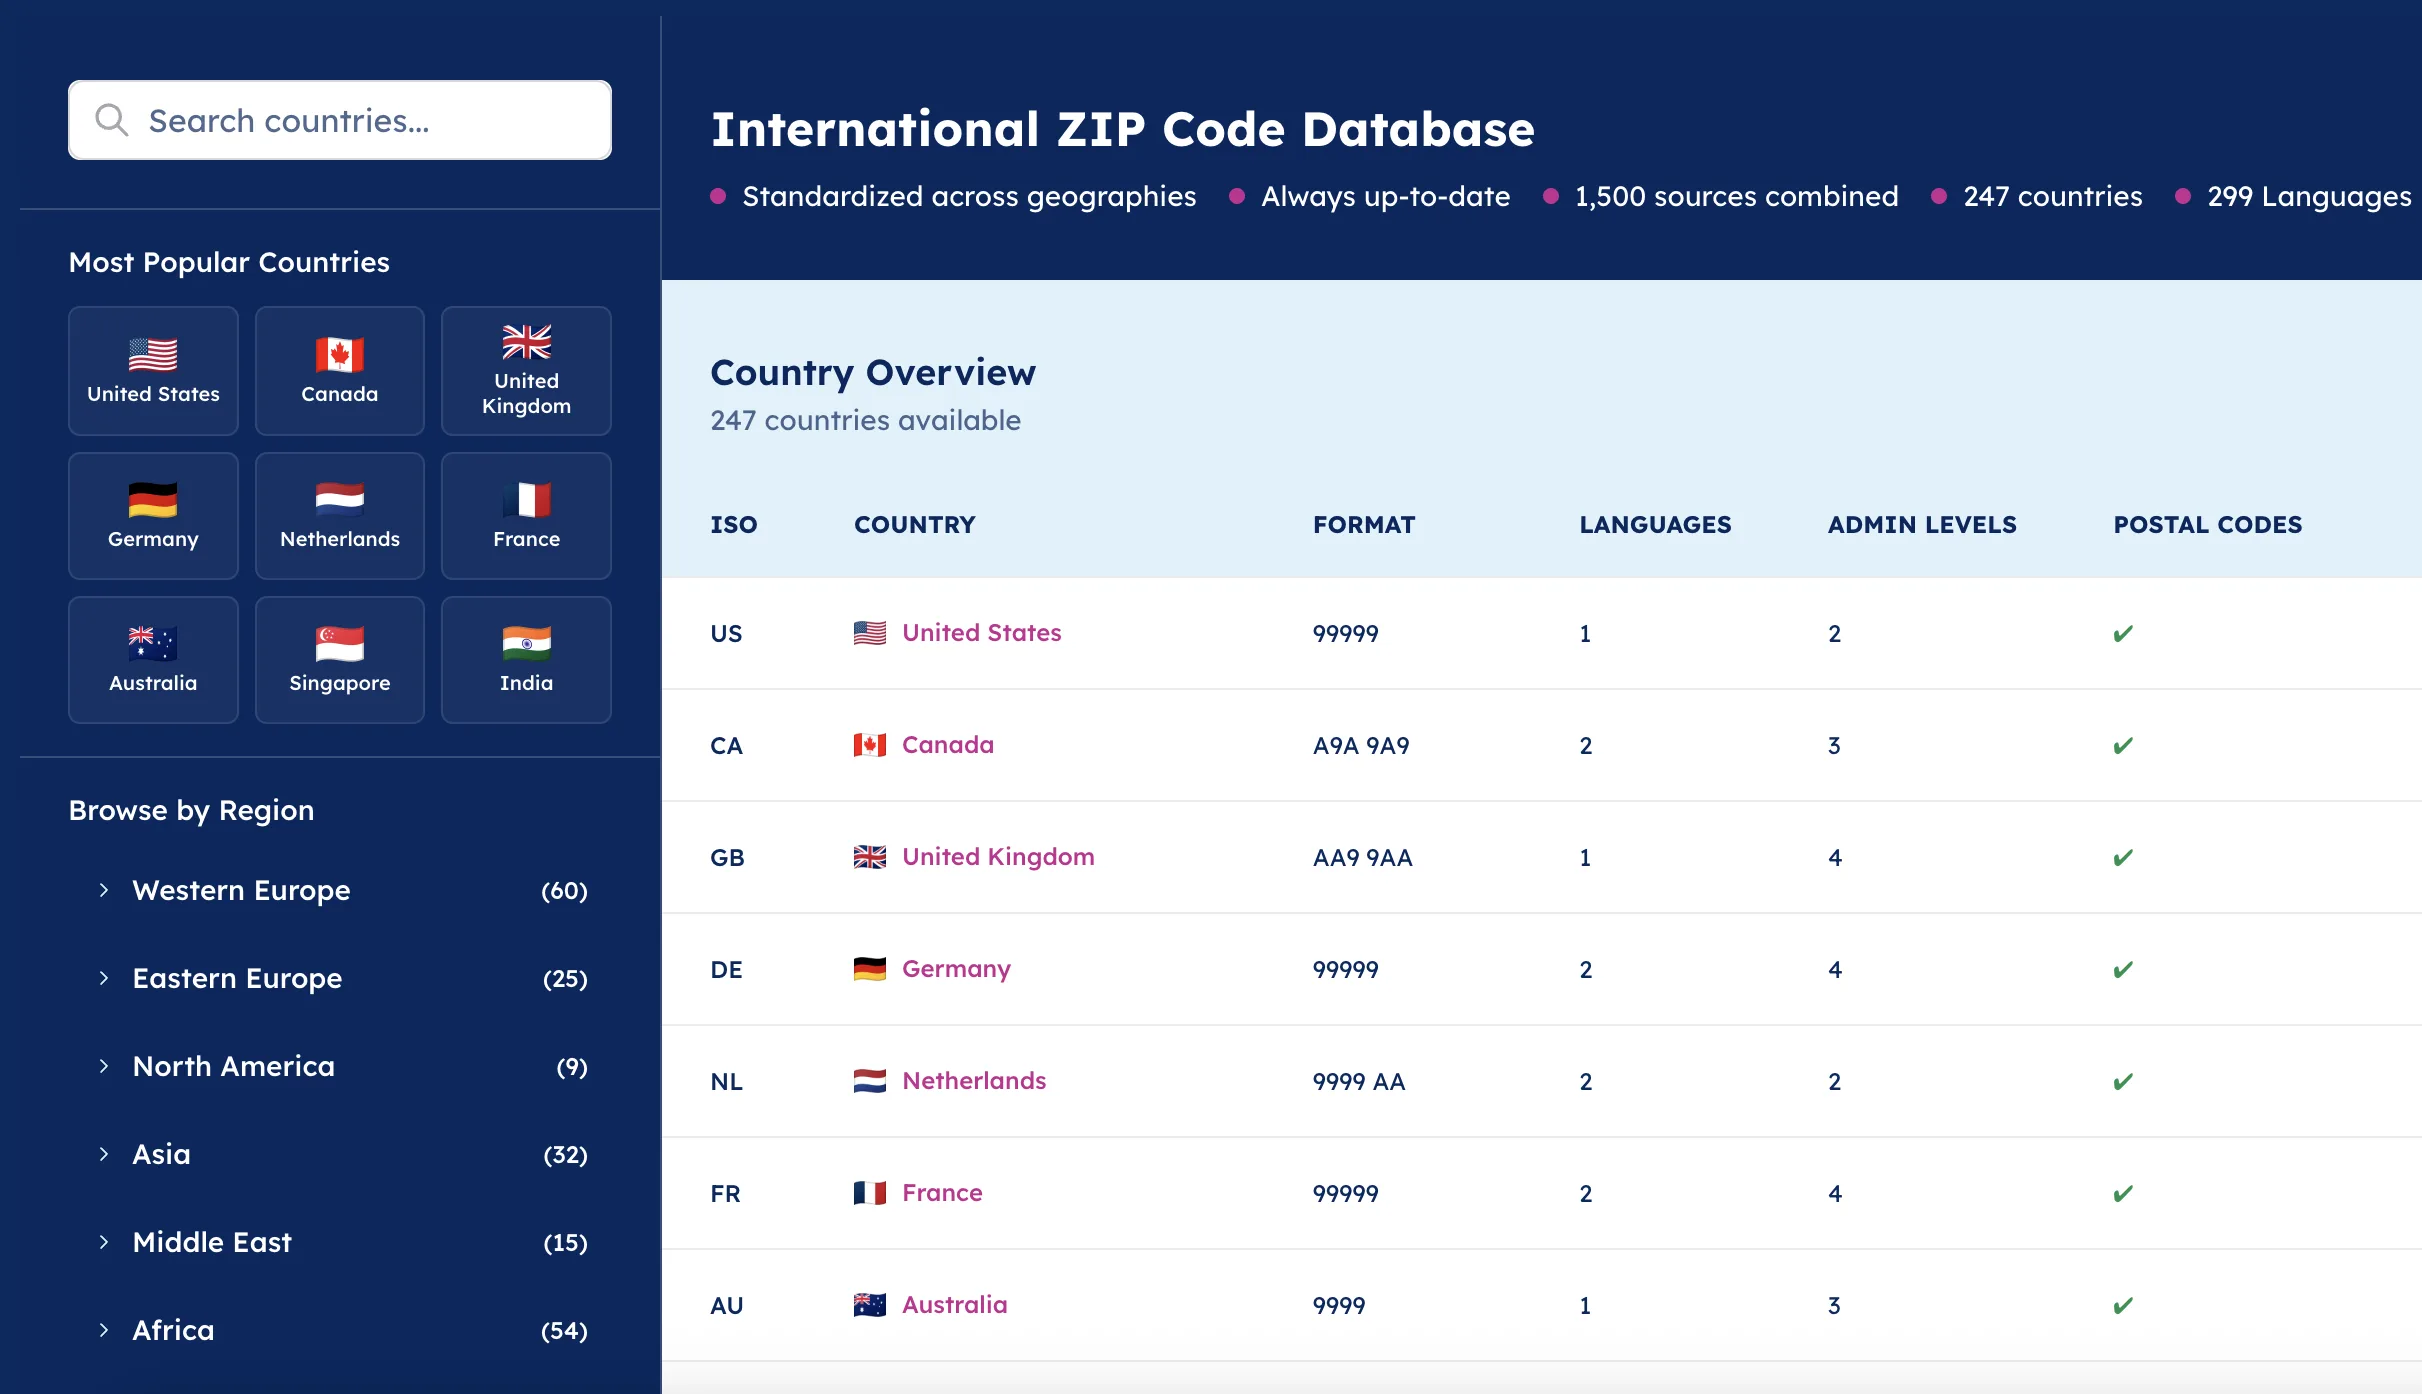
💡 Use accurate data to create a zip code map. We offer the most comprehensive and up-to-date international zip code data for enterprises. Browse GeoPostcodes datasets for free and download a sample here.
The data and tools you’ll need
To follow this tutorial, you will need:
- A computer with a Python development environment; I use Spyder, which comes with the Anaconda Python distribution, but other editors like JupyterLab will also work (use the following script).
- You will also need the provided zip code sample CSVs downloaded to your computer. Check our portal to download zip code data.
Understanding Zip/Post Codes and Geospatial Data
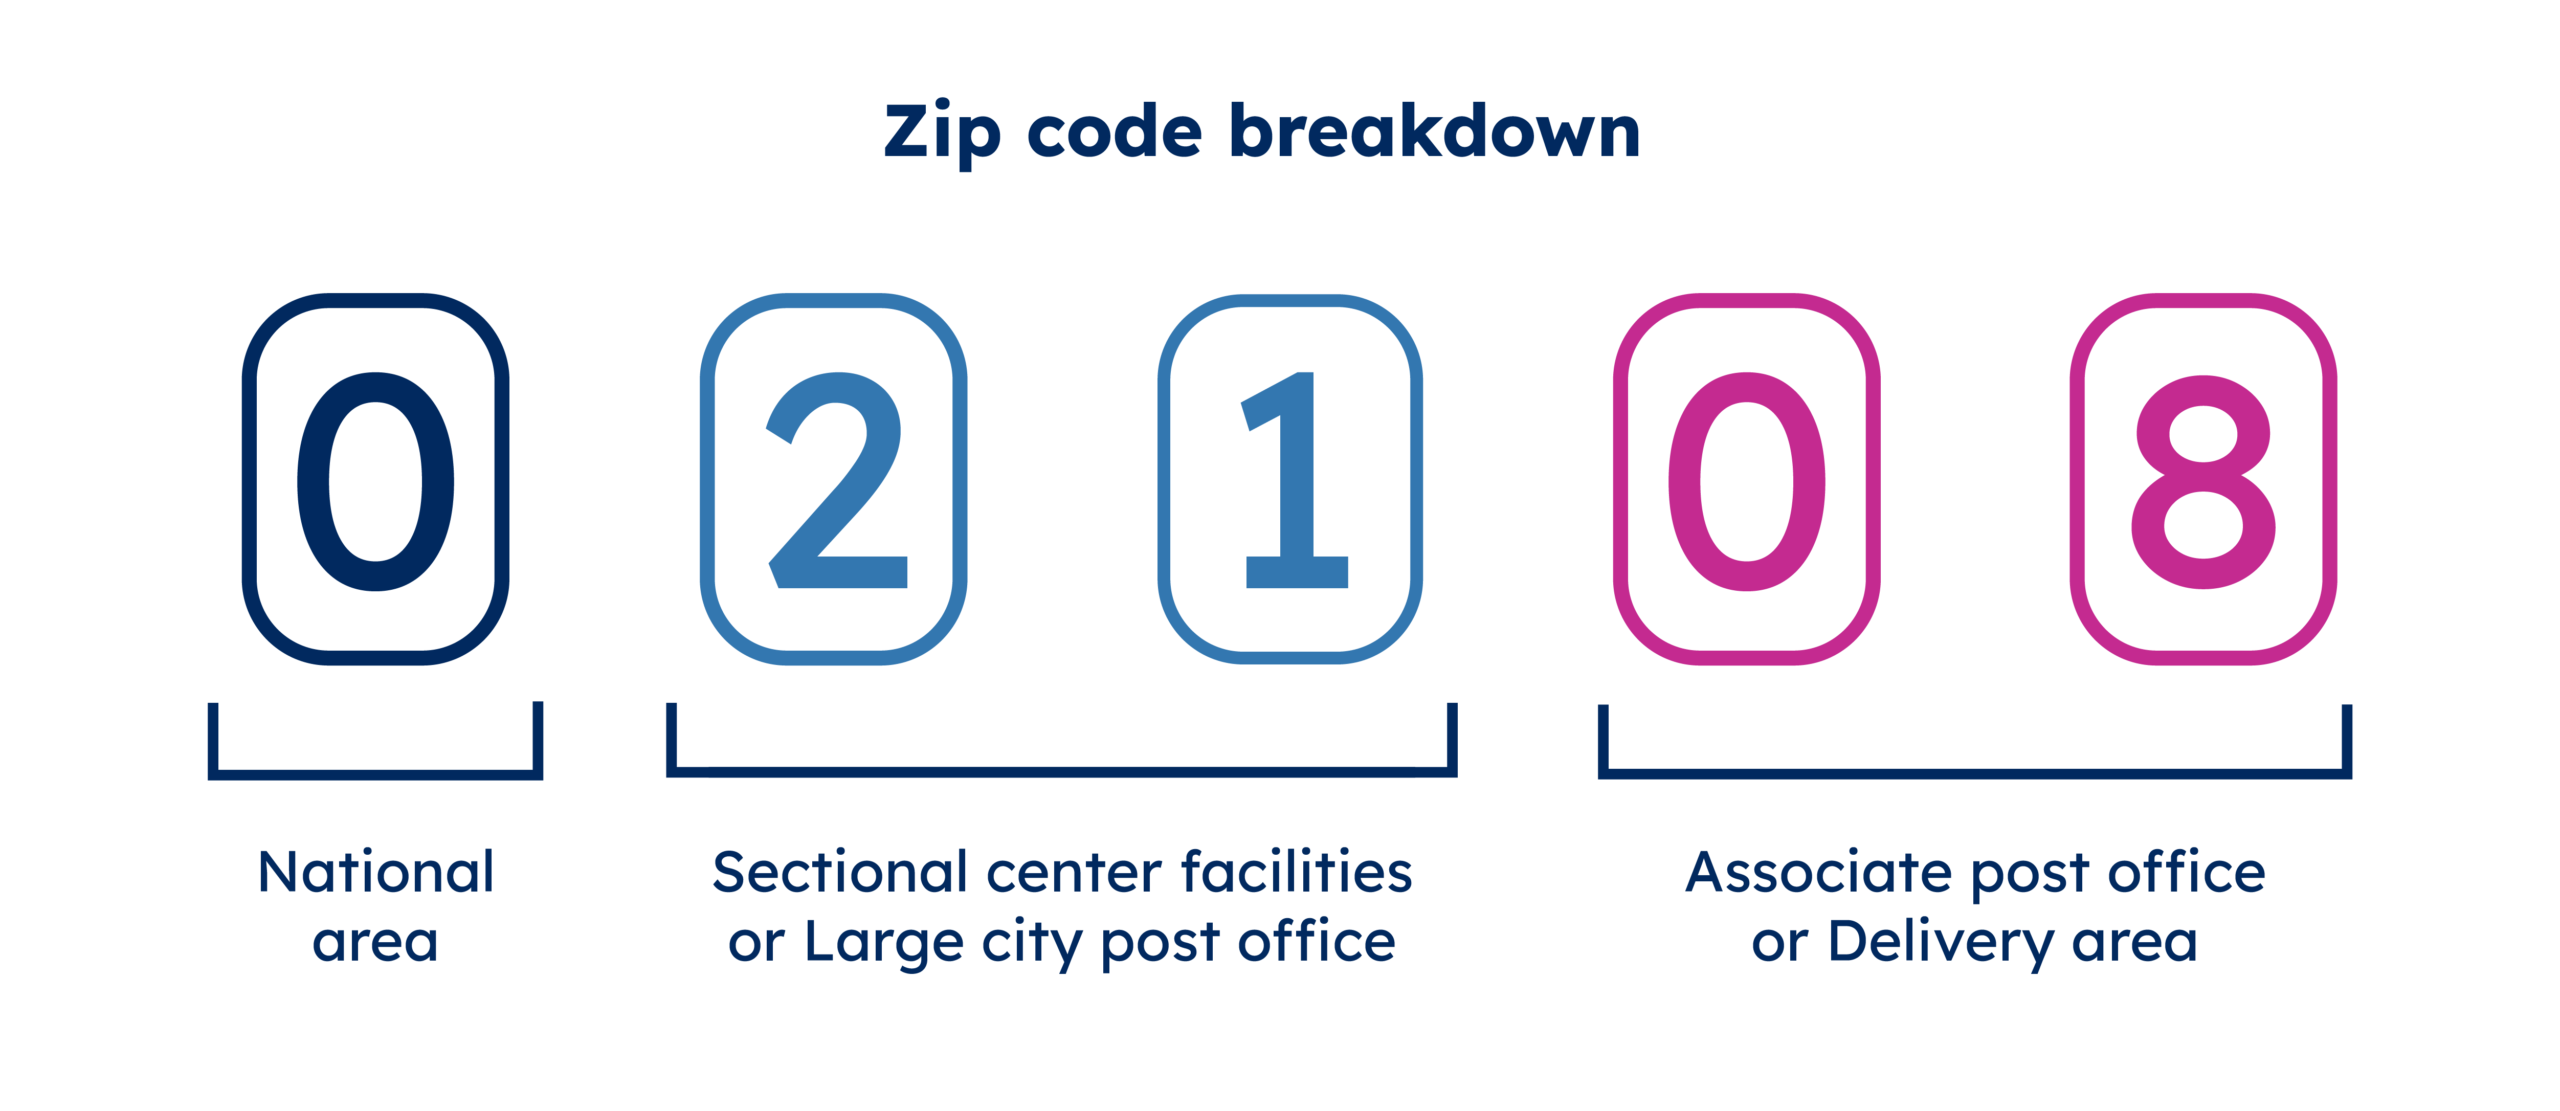
Zip codes in the United States and postcodes worldwide are alphanumeric systems employed by postal services to enhance mail sorting and delivery efficiency. In the U.S., zip codes, consisting of five digits, signify regions, sectional center facilities, and specific post offices. Internationally, postcodes vary in format but share the purpose of facilitating effective mail distribution.
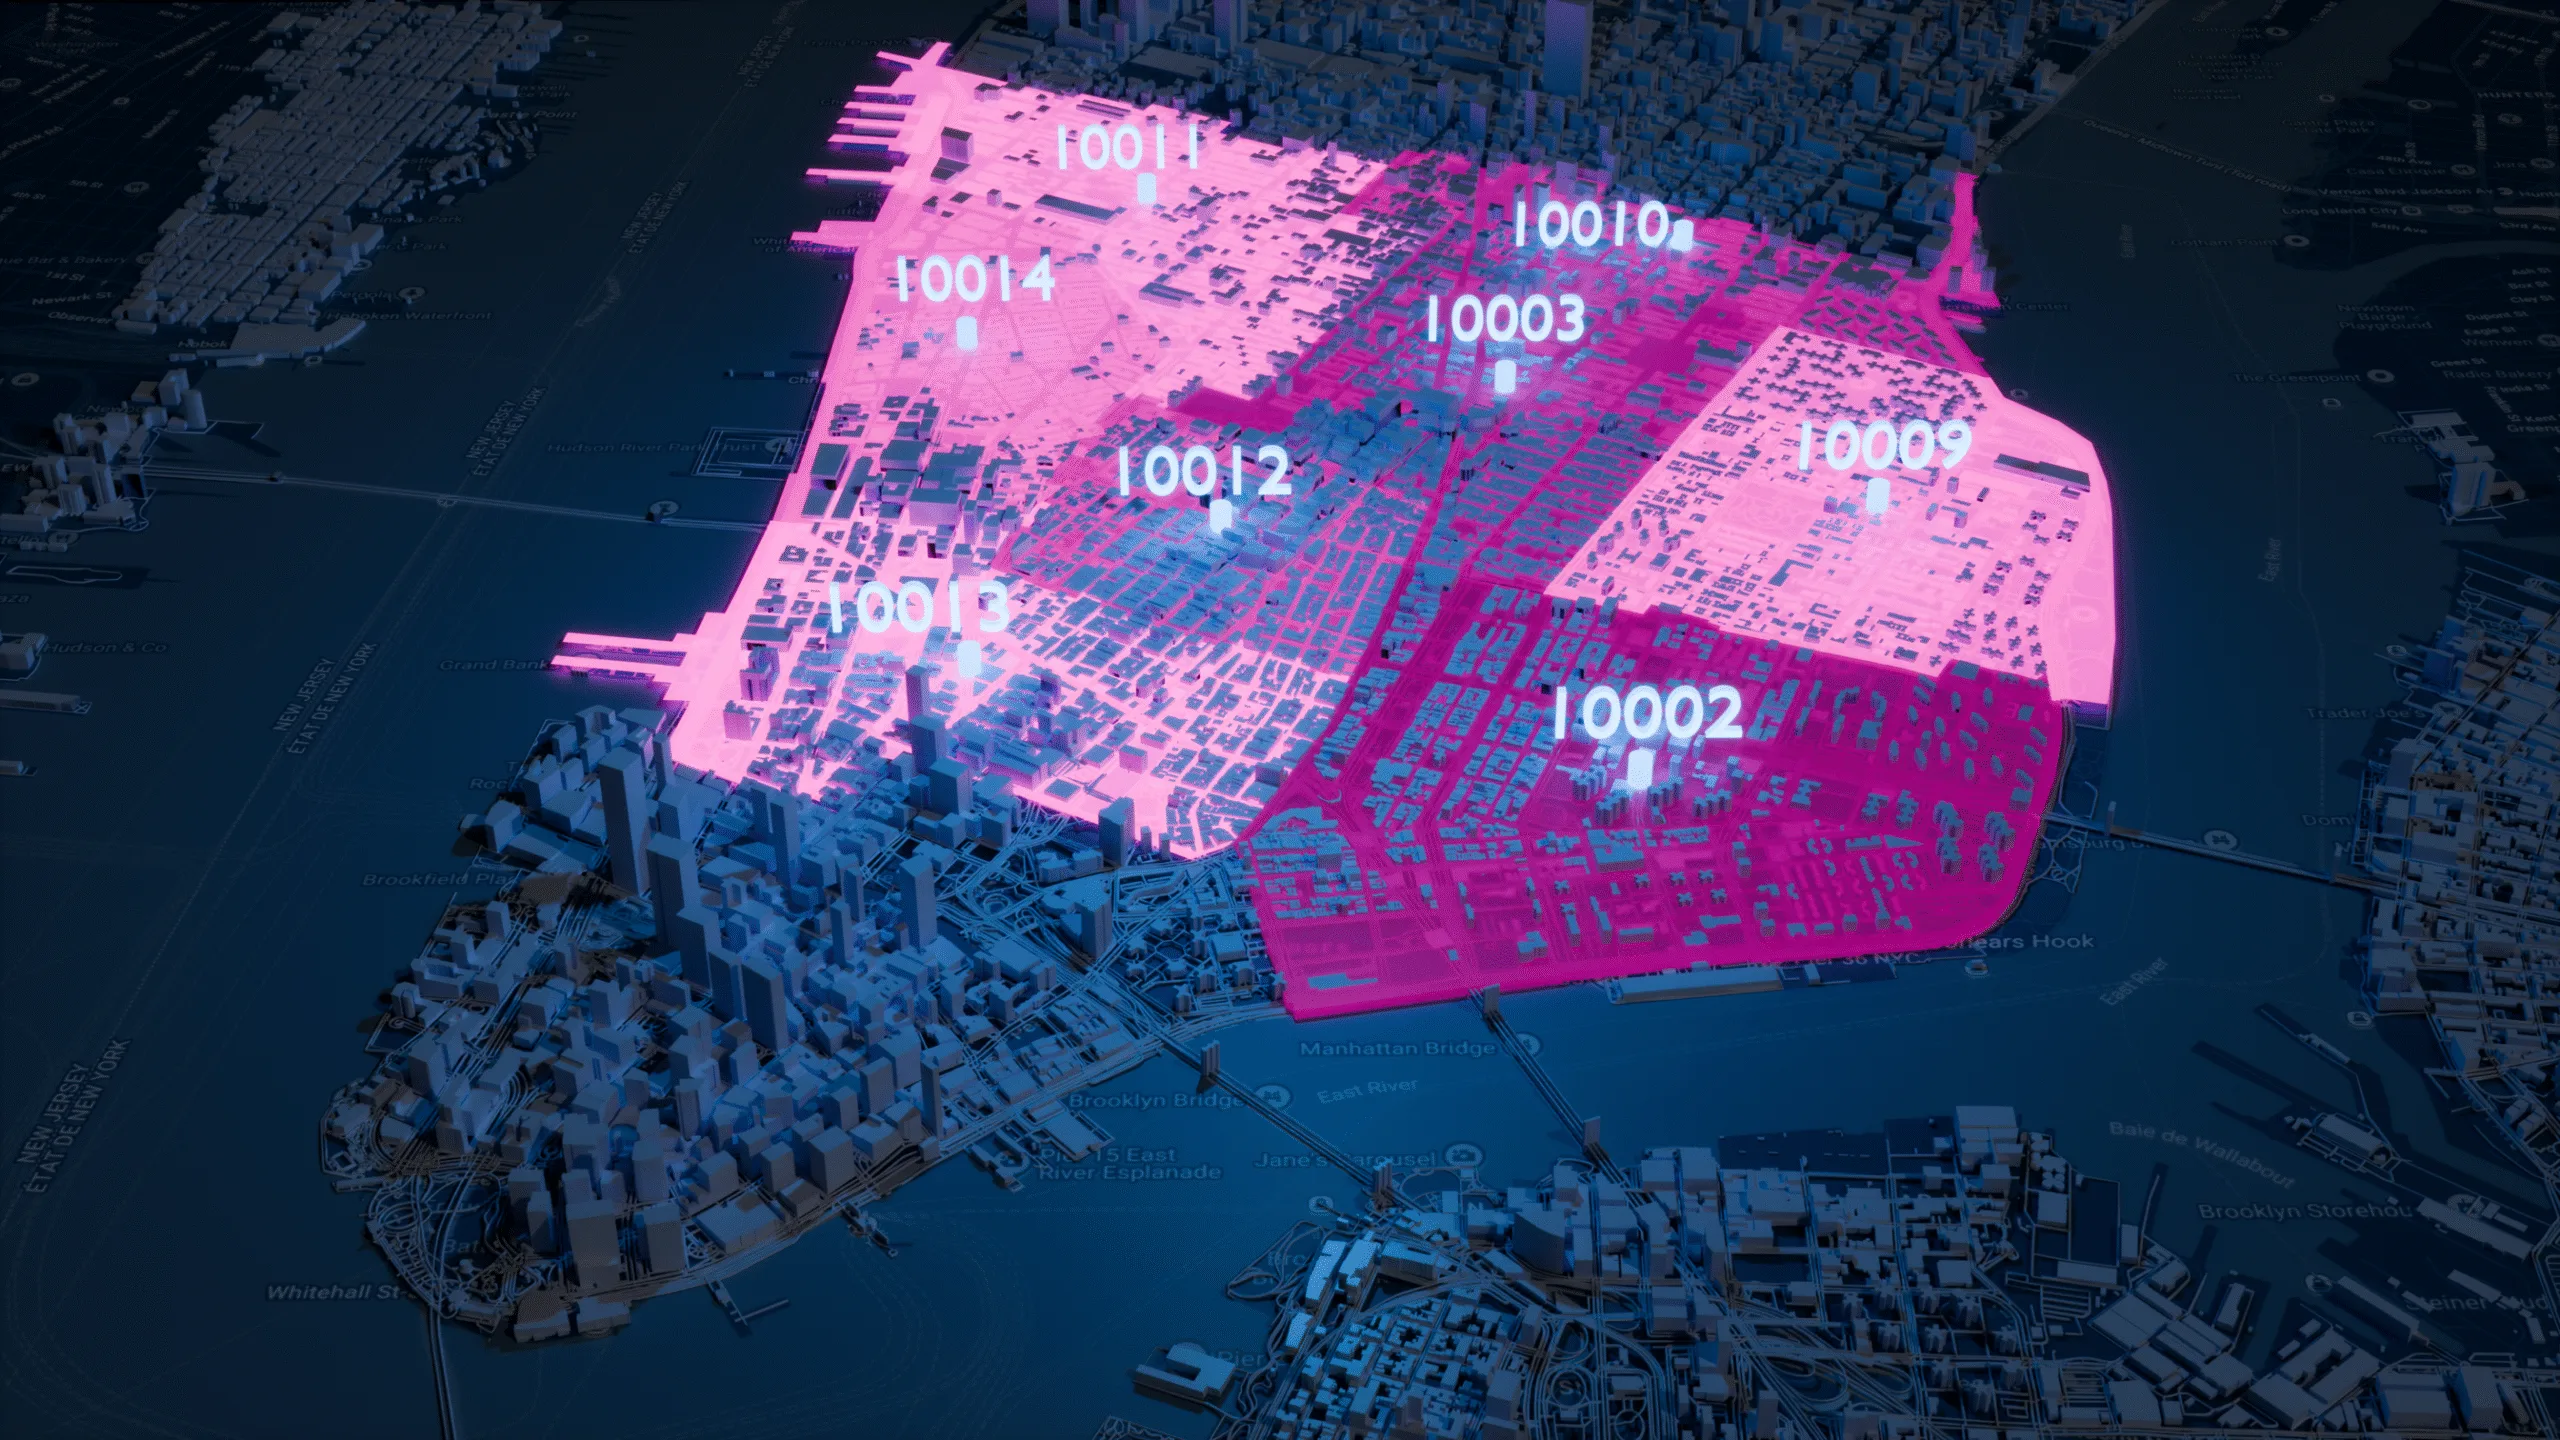
These codes are essential for geospatial data, providing geographic attributes crucial for various applications. By utilizing zip or postal codes and knowing the latitude and longitude of an address, we can plot them on a map with some of their other attributes, like what city they belong to.
Zip codes are also widely used in business. For example, zip code data can be used to analyze business data to spot trends, map sales territories, optimize logistics, and fine-tune marketing efforts for specific areas.
The Role of Zip Codes
Before using Python code to calculate the distance between two points or two zip codes, we need information about their geographic coordinates, specifically latitude (lat) and longitude (long).
- Latitude is the angle between the equator and a point on the earth’s surface, measured in degrees north or south.
- Longitude is the angle between the prime meridian and a point on the earth’s surface, measured in degrees east or west.
Together, latitude and longitude form a unique pair of numbers that can pinpoint any location on the globe.
Geospatial Data Sources for Zip Codes
There are many sources for geospatial data for zip codes, such as APIs and open-source files, but the most straightforward are CSVs and preexisting Python packages.
In my Python script, I’ll utilize GeoPostcodes‘ standardized postcode files for the US and Nominatim from the GeoPy package, allowing me to calculate zips not included in the CSV files.
💡 Our GeoPostcodes postcode files have the advantage of being regularly updated to ensure accuracy and up-to-date data. Download a free sample on our website if you haven’t yet done so.
Setting Up Your Environment
To create a zip code map in Python, you’ll first need to install a few essential libraries. Below are the libraries needed for this project:
1. Libraries Overview
We are using three main libraries: Plotly, Pandas, and Geopy. Each has its own unique strengths:
- Plotly: An incredibly powerful library for creating interactive visualizations in Python. In this project, we use it to build a zip code map, allowing the user to hover over points to see details like zip codes, localities, and regions.
- Pandas: This library is essential for manipulating data, particularly when working with CSV files. It helps us organize zip codes, latitudes, and longitudes into an easily readable and modifiable DataFrame. The structured data is then passed into the Plotly visualization.
- Geopy: A versatile library for geospatial data used primarily for geocoding (converting zip codes into latitudes and longitudes). The Nominatim geocoder within Geopy connects to OpenStreetMap to fetch coordinates for zip codes when not available in local data.
2. CSV Data Reading: Tailoring for Different Structures
The code reads CSV files containing zip code data. This part is flexible and can be adapted to fit different datasets. Here’s how it works:
- Reading CSV Files: The script uses Pandas to read a CSV file containing postal codes, latitude, and longitude data. You specify the path to the file, and the script loops through it, extracting the zip code and coordinates.
- Adapting to Different Data Structures: Depending on how your data is structured, you may need to modify the column names. In the example, columns are labeled ‘postcode’, ‘latitude’, and ‘longitude’. You might need to change these if your CSV uses different labels.
- Fallback to Nominatim: If any coordinates (latitude or longitude) are missing, the script will call Nominatim to attempt fetching them. This is crucial when dealing with incomplete datasets.
# Path to your CSV file (adjust the path and input row names to fit)
csv_file = r"C:\\path\\to\\your\\csv\\GPC-PLACES-GEO-SAMPLE-US.csv"
reader = pd.read_csv(csv_file, delimiter=';')
for row in reader.itertuples():
    zip_code = row.postcode
    latitude = row.latitude if pd.notna(row.latitude) else None
    longitude = row.longitude if pd.notna(row.longitude) else None
    # Fallback to Nominatim if latitude and longitude are missing
    if latitude is None or longitude is None:
        longitude, latitude = get_coordinates_from_nominatim(zip_code)
3. Nominatim: Geocoding with OpenStreetMap
Nominatim is a powerful tool within the Geopy library that allows us to fetch latitude and longitude coordinates based on zip codes or addresses. This section comes into play when your CSV lacks geographical coordinates. Here’s how it works:
- How Nominatim Works: Nominatim uses OpenStreetMap data to convert a postal code or address into geographic coordinates. If the CSV data is incomplete, it will call Nominatim to obtain the missing lat/lon pairs.
- Fallback System: The function get_coordinates_from_nominatim() checks whether a zip code exists in your CSV. If not, it fetches coordinates from Nominatim, helping you complete missing data.
def get_coordinates_from_nominatim(postal_code, country=None):
    geolocator = Nominatim(user_agent="geo_app")
    location = geolocator.geocode({'postalcode': postal_code, 'country': country})
    if location:
        return location.longitude, location.latitude
    else:
        print(f"Coordinates not found for postal code: {postal_code}")
        return None, None
- Country-Specific Queries: When calling Nominatim, it’s essential to pass the country along with the postal code. This avoids errors caused by duplicate zip codes used in multiple countries.
4. Data Visualization: Building Interactive Maps
Once you have zip codes and their corresponding latitudes and longitudes, you can create an interactive map with Plotly. This section outlines how to visualize the data:
- Creating the Map: Using the scatter_mapbox() function in Plotly, the script plots each zip code on a map, with hover functionality to display details like the zip code, region, and locality.
- Customization: You can control the look and feel of the map by customizing various attributes, such as the color of the points (by zip code), the size of the markers, and the zoom level of the map. Here’s a snippet that shows how the points are plotted:
fig = px.scatter_mapbox(
    zip_code_data,
    lat="latitude",
    lon="longitude",
    hover_name="postcode",
    hover_data={
        "region1": True,  # Displays region1 (state)
        "region2": True,  # Displays region2 (county)
        "locality": True  # Displays locality (city)
    },
    color="postcode",  # Color each point by its postal code
)

fig.update_traces(marker=dict(size=12))  # Uniform size for all points
- Map Centering and Zoom: The map is centered based on the mean latitude and longitude of all the zip codes plotted. You can adjust the zoom level to focus on smaller or larger areas, depending on the scale of the data.
fig.update_layout(
    mapbox_style="open-street-map",
    mapbox_center={"lat": zip_code_data['latitude'].mean(), "lon": zip_code_data['longitude'].mean()},
    mapbox_zoom=5,  # Adjust zoom level
)
5. Bringing It All Together: The Full Script
Now that we’ve explained the purpose of each section, here’s how to put it all together into a single working script. This script will:
- Read a CSV file to extract zip codes and coordinates.
- Use Nominatim to fill in missing data.
- Create an interactive map using Plotly.
import pandas as pd
import plotly.express as px
from geopy.geocoders import Nominatim

# Define country and example zip codes (replace with your own)
country = "Belgium"
zip_codes = ["1000", "1030", "1040"]

# Function to get coordinates using Nominatim
def get_coordinates_from_nominatim(postal_code, country=None):
    geolocator = Nominatim(user_agent="geo_app")
    location = geolocator.geocode({'postalcode': postal_code, 'country': country})
    if location:
        return location.longitude, location.latitude
    else:
        print(f"Coordinates not found for postal code: {postal_code}")
        return None, None

# Dictionary to store zip code data
coordinates_dict = {}

# Check if zip codes are provided; if not, load from CSV
csv_file = r"C:\\path\\to\\your\\csv\\GPC-PLACES-GEO-SAMPLE-US.csv"
reader = pd.read_csv(csv_file, delimiter=';')

for row in reader.itertuples():
    zip_code = row.postcode
    latitude = row.latitude if pd.notna(row.latitude) else None
    longitude = row.longitude if pd.notna(row.longitude) else None

    if latitude is None or longitude is None:
        longitude, latitude = get_coordinates_from_nominatim(zip_code)

    if latitude and longitude:
        coordinates_dict[zip_code] = (longitude, latitude)

# Convert dictionary to DataFrame
zip_code_data = pd.DataFrame([
    {'postcode': key, 'longitude': value[0], 'latitude': value[1]}
    for key, value in coordinates_dict.items()
])

# Create the map with Plotly
fig = px.scatter_mapbox(
    zip_code_data,
    lat="latitude",
    lon="longitude",
    hover_name="postcode",
    hover_data={
        "postcode": True
    },
    color="postcode",
)

# Customize map layout
fig.update_traces(marker=dict(size=12))
fig.update_layout(
    mapbox_style="open-street-map",
    mapbox_center={"lat": zip_code_data['latitude'].mean(), "lon": zip_code_data['longitude'].mean()},
    mapbox_zoom=5,
    title="Zip Code Map"
)

fig.show()
Conclusion
We discussed the role of zip codes in organizing locations for efficient mail delivery and highlighted their importance in geospatial data despite their limitations in perfectly representing geographic areas.
Leveraging powerful Python libraries like Geopy and Plotly, we demonstrated how to read coordinates from CSV files and dynamically plot them on an interactive map. Our script seamlessly integrates Nominatim for geocoding, making it versatile enough to handle both existing datasets and missing location data.
Creating zip code maps with Python is a practical approach to uncovering patterns in geographic data. Whether you’re visualizing customer locations or exploring population distributions, Plotly’s interactivity turns raw data into informative and engaging maps.
At GeoPostcodes, we offer accurate, geocoded postal data that can be used for such visualizations. Our regularly updated datasets ensure that your analysis is based on the latest information. Download a free sample from our site today and see how our data can bring your projects to life!
FAQ
How to plot a zip code on a map?
To plot zip codes on a map, you can use several methods:
- Use online tools like RandyMajors.org or Mapize, which allow you to input zip codes to generate custom area maps on Google Maps.
- Employ software like EasyMapMaker or create maps using R with packages such as Tigris and tidycensus.
How to use zipcode in Python?
You can utilize libraries like zipcodes, uszipcode, or geopy to use zip codes in Python.
- zipcodes: Install with
pip install zipcodes. Use functions likezipcodes.matching('zip_code')to get detailed information about a zip code orzipcodes.similar_to('partial_zip')to find similar zip codes. - uszipcode: Install with
pip install uszipcode. Use the SearchEngine class to search by zip code, coordinates, or other criteria. - geopy: Install with
pip install geopy. Use the Nominatim geolocator to get address details from a zip code.
Can Google Maps show zip codes?
Google Maps does not natively display ZIP code boundaries.
You can use external tools and maps, such as those provided by RandyMajors.org, or custom solutions using GeoJSON files to visualize ZIP code boundaries.
How to read zip codes?
To read a zip code, start with the five-digit code specifying the general area.
For a ZIP+4 code, pause after the five digits and say “dash” or briefly pause, then continue with the additional four digits, which specify a more precise delivery segment.
How can I create a python zip code map?
To create a zip code map in Python, use geospatial libraries like geopandas, matplotlib, and folium to visualize zip codes.
Start by loading your zip code level data into a data frame using import pandas as pd.
Then, overlay the data on a map using a geojson file that contains zip code boundaries.
Choropleth maps can be used to show the data distribution at the zip code level.
How do I import and organize zip code level data for visualization?
You’ll need to import a geojson file that contains zip code boundaries and use pandas to organize your zip code level data into a data frame.
After that, merge this new data frame with the existing geographic data to prepare it for mapping.
Use pandas to handle the numeric operations.
Can I create choropleth maps for zip codes using Python?
Yes, Python is great for creating choropleth maps at the zip code level.
You can use libraries like folium to generate interactive maps, where data is represented using different colors based on the value ranges in your data.
You just need to ensure you have zip code level data and the corresponding zip code boundaries in your geojson file.
What are the possible geographic levels I can use when creating maps?
When creating a zip code map in Python, you can visualize data at different geographic levels.
You might map data at the county level or zoom in for more granular views at the zip code level.
Both levels can be represented in a choropleth map, depending on the granularity of your data.